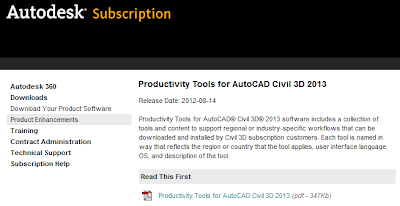
On Wednesday of this week, Autodesk released productivity tools for Civil 3D 2013 for subscription clients. The enhancements includes a Borehole Utility, Cartogramma Utility, Corridor Solids Extraction, Curb Gutter Roadway Subassemblies, Extension for Civil View, GENIO Import/Export, 12D Data Extension, PISTE Translator, and Clip/STRAM Translator. Note some of those utilities are for certain languages only.
The tool with in the extension that I will be looking at it the Cartogramma Utility. It is used to give a graphical representation of earth works in designed area. Once the utility has been installed, it should reside in the Toolbox, as seen in the capture below.
By simply executing the create cartogramma command, you should see the following pop up box:
The draw cartogramma box allows the user to select the two surfaces to compute against. It also allows one to select the boundary and origin point to where the display should begin. Finally, the settings options determine the hatch patterns for cut and fill, along with the grid lengths of the squares. The following capture shows what should display.
In the capture below, I have zoomed into a small area to show with more detail what data will be displayed. The three numbers at the corner of each grid represent the existing and design grade, along with the difference between the two. The plus or minus number in the region represents the volume of cut or fill within the region.
Lastly, at the bottom of the visualization, there is a table that sums the cut and fill for each column as seen below.
At the end of the table, you can see that the table sums the rows of cut and fill for the region selected.


vdxdxfvxdfv
ReplyDelete